Hi, and welcome to sterilization 201.
If you are new to this topic or to growing mushrooms in general, I put some great content for you together in my article Things to know before starting a mushroom farm.
Let’s get started.
DEFINITION of STERILIZATION
Before we can grow mushrooms, the substrate has to be sterilized in one form or another. When it comes to sterilization, we distinguish between
- Pasteurization at 60-80°C, up to 5 day, and 0 Psi.
- Super-Pasteurization at 80-100°C, for around 15 hours, and 0 Psi.
- Sterilization at ≥ 100°C, for 1-2 hours at 15 Psi.
Besides sterilizing the substrate, we also have to take care of our tools like scalpels, cups, and so on. On the next paragraphs, we will focus primarily on the sterilization of the substrate.
While we talked already about the different processes, we can distinguish sterilization also according to the various methods.
- Composting
- Chemical sterilization
- Hot water immersion
- Steam sterilization (autoclave or pressure less)
With that said, let’s look first at the process itself shown in figure 1. Each sterilization process consists primarily of three phases: ramp up, sterilization, and cool down. How fast you can ramp up or cool down determines how long the whole sterilization process will take. While in most cases, the ramp-up phase can be shortened by increasing the heating process, there is a limit on how fast you can cool down the sterilization chamber.

Figure 1: Example of a sterilization process (own fig.)
The yellow arrow in figure 1 indicates the point at which the substrate can be unloaded from the sterilization chamber. The time to unload depends on where you put your sterilization unit. If your sterilizer is directly connected to your inoculation room than you can unload way earlier (be aware not to unload too early, because you can hurt yourself due to the hot equipment) than if you set it up outside.
This is because in the inoculation area, the air is cleaner, and the likelihood for contaminating the substrate is lower than unloading outside the room.
If you have connected your sterilization unit directly to the inoculation room than you not only can unload earlier, you can already start a new run while waiting for the cooldown of the first load. This saves time and therefore, money.
When it comes to sterilization itself, there are several ways to do it: bulk sterilization and bag or bottle sterilization (figure 2). Bulk sterilization is typically used in button mushroom cultivation or oyster mushroom cultivation, while shiitake and oyster mushrooms generally are sterilized in bags or bottles.

Figure 2: Comparison of the bulk process (left) and bag/bottle process (right) (own fig.)
Figure 2 shows the main differences between bulk and bag/bottle process. While in the bulk sterilization the substrate is first sterilized, then inoculated and then filled (if needed), for the bag/bottle process the substrate is first filled into the bags/bottles and then after the sterilization inoculated.
Besides these differences, there is another one. If you think about the volume you can sterilize at once the bulk process outperforms the bag/bottle process. This is even true if you’re using a big autoclave for your bags/bottles.
STERILIZATION with COMPOSTING
Composting is typically used for growing button mushrooms (Agaricus). But it also found its way into growing oyster mushrooms (Pleurotus).
Composting is a two-step process:
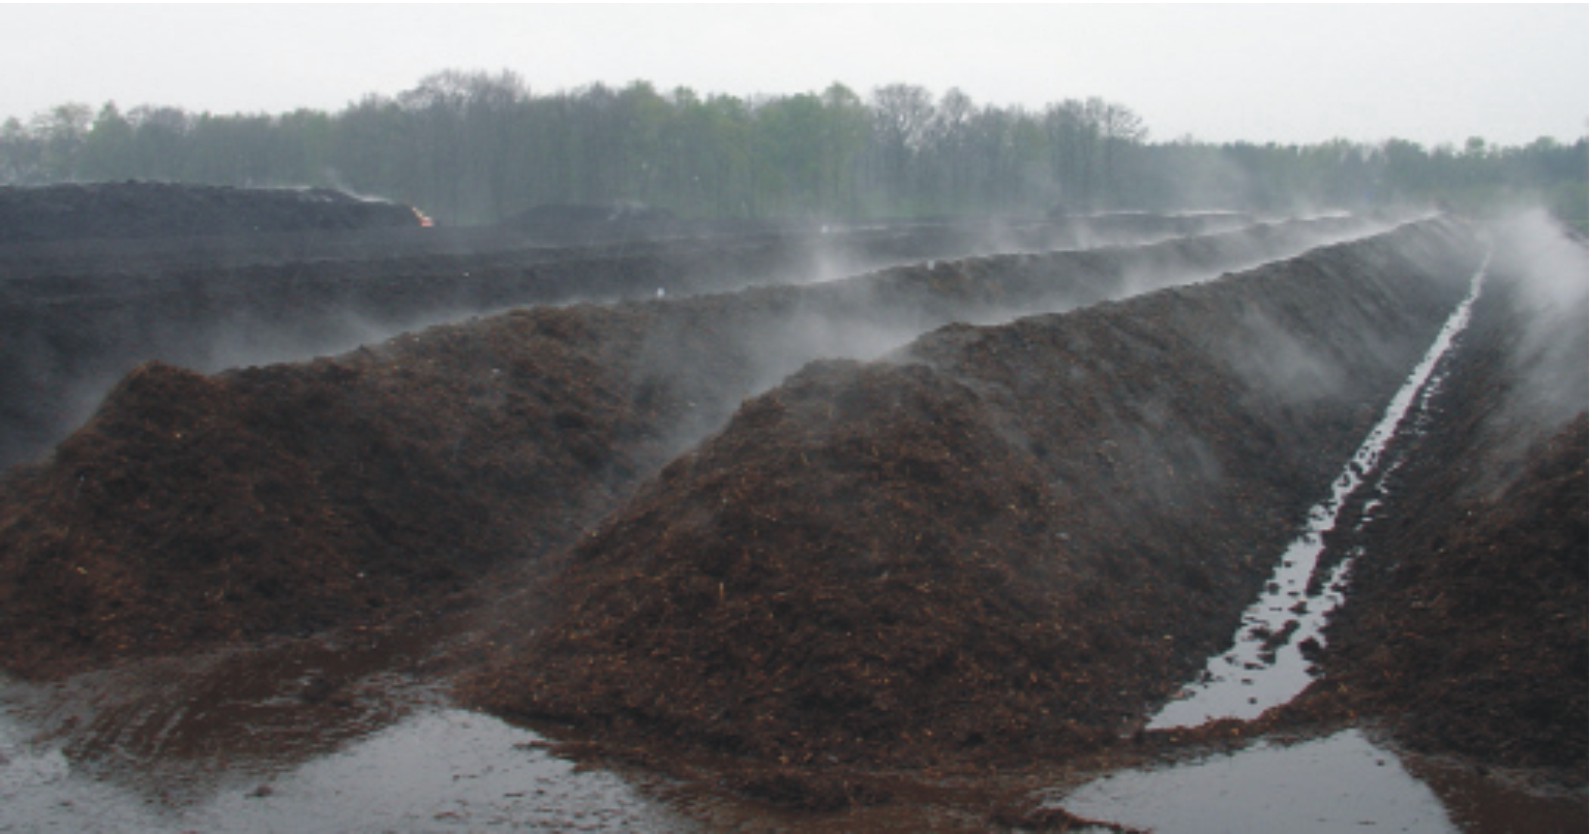
- Phase 1, which is typically done outside (Figure 3), is a biological and chemical process and the first step to decompose the mixed raw materials. During this time this phase the substrate itself heats up to 80°C.

Figure 3: View over piles of compost. Source
- Phase 2, which is done inside (Figure 4 and Figure 5), is a biological process to finalize the decomposing. While in phase 1, the temperature is uncontrolled, in phase 2, the temperature is strictly controlled for a certain amount of time. In the first part of this phase – the pasteurization phase – the temperature is set to 56-60°C for 8 hours. After that, the temperature is dropped to 45°C for up to 7 days – the so-called conditioning period. The conditioning period ends after the volatile ammonium has been cleared form the process air.

Figure 4: Sketch of a tunnel[1]

Figure 5: View into a tunnel. Source
WHAT happens during COMPOSTING
In a research paper the author analyzed the change of the bacterial composition during the composting process. As we can see in figure 6 (A) the longer we compost, the higher the Rottegrad.
At the same time, we see in figure 6 (B) that the longer we compost the number of bacteria and actinomycetes decreases, and the amount of fungi increases.
We also see (figure 6 c) that the longer the composting process, the lower the C:N ratio and the lower pH value.

Figure 6: Typical process parameters and microbial abundance during composting.[2]
Besides these changes, we that the type of microorganism changes throughout the process (Figure 7 and Table 1).

Figure 7: Temperature range pf psychotolerant, mesophile and thermophile organisms, and their generation time.[3]

Table 1: Approximate number of microorganisms during different phases of composting.[4]
TEMPERATURE ZONES in the PILE
If we look inside a pile of compost, we see two different things. First, the airflow (Figure 8) throughout the pile and second, the temperature zones (Figure 9) within the pile.

Figure 8: Airflow through the substrate.[5]
Especially the temperature zones within the pile are playing an essential role in how well the substrate is composted (Rottegrad). These zones are indicating hot or cold pockets. For that reason, the pile has to be rotated during phase 1.

Figure 9: Temperature zonation during long composting (left) and short composting (right).[6]
With this short introduction into composting, let’s look together at some science paper to learn more about this interesting topic.
HOW to IMPROVE COMPOSTING
In the first paper, the author improved the composting procedure to enhance the substrate quality and yield of Agaricus bisporus. The author introduced a system of pipes which were placed inside the piles (Figure 10 and 11).

Figure 10: Perpendicular arrangement of perforated HDPE pipe in the compost pile.[7]

Figure 11: Parallel arrangement of perforated HDPE pipe in the compost pile.[8]
The author runs a total of four tests (T1 to T4)[9]. The temperature profiles of these tests are shown in figure 12 to 15. These figures describe the temperature profile during the composting process.

Figure 12: Temperature pattern during the composting process for T1.[10]

Figure 13: Temperature pattern during the composting process for T2.[11]

Figure 14: Temperature pattern during the composting process for T3.[12]

Figure 15: Temperature pattern during the composting process for T4.[13]
As we already learned, during the composting process, the C:N ratio drops, which is again demonstrated by this paper (Figure 16).

Figure 16: Analysis of C:N ratio during the composting process.[14]
To understand the impact of these temperature profiles and C:N ratios, we have to compare the different yields of these tests (Figure 17 and 18). As we can see, the shorter the composting process, the more likely that we will get something out of the substrate.
For the S-11 strain, the best yield could be achieved by using the T3 method (Figure 17, yield 27%).

Figure 17: Yield (%) of the S-11 strain of Agaricus bisporus on compost prepared under different treatments. (own fig. based on Wakchaure )
The same is true for the U-3 strain (Figure 18, yield 21%). Both results indicate that a shorter composting process leads to a higher yield.

Figure 18: Yield (%) of the U-3 strain of Agaricus bisporus on compost prepared under different treatments. (own fig. based on Wakchaure )
The author comes to the conclusion that the HDPE pipes (10% perforation) increased the yield by 27.6%. T3 was found to be the best. He also found that the arrangements of the HDPE pipes and the environmental conditions during composting affects the substrate quality.
HOW to USE COMPOSTING for OYSTER Mushroom Cultivation
While the author of the first paper used composting as a sterilization method for increasing the yield of Agaricus bisporus, the author of the second paper used the composted substrate for the cultivation of Pleurotus spp.
Which is kind of a contradiction. Because as you already know Pleurotus spp. Is a primary decomposer.
The author used wheat straw (Triticum aestivum) as the primary substrate and supplemented it with alfalfa (Medicago sativa, 5% w/w of dry straw). The substrate was chopped into 1-6 cm pieces and moisture to a moisture content of 75% w/w.
The following process was used:
- Composting 7 days, 60-70°C, daily mixed
- Filling into tunnels
- Heating to 65°C
- Pasteurization 18h, 65°C
- Conditioning 48h 48°C
- Cooldown to 25°C
The temperature profile of the composting process is shown in figure 19.

Figure 19: Temperature changes during substrate preparation. Numbers are depicting the sampling points (stage number).[15]
While table 2 shows the different stages at which the process was investigated.

Table 2: List of investigated stages during substrate preparation.[16]
The more interesting part is shown in figure 20. Here the author compared the results of 11 different test runs. In this figure, the yield is calculated as the percentage of wet weight kilograms of fresh mushrooms per 100 kg substrate.

Figure 20: Mushroom yield of the investigated production series. The yield was determined as a percentage of wet weights of kilogram fresh mushrooms per 100-kilogram substrate block. Bars indicate standard deviation for individual production series, based on yield values of different mushroom production houses. The thick lines show the mean ± standard deviation range for the entire dataset.[17][18]
To put these findings into context, we come back to the definition of biological efficiency (BE). The BE is defined as 1 kg of fresh mushrooms for 1 kg dry substrate or 1 kg of fresh mushroom for 4 kg wet substrate (75% water content). As the author watered to a moisture content of 75%, we will use the second definition.
Example: 7-118, ~ 15% yield
1 kg of fresh mushrooms per 4 kg of substrate equals BE 100%
15 kg of fresh mushrooms per 100 kg of substrate equals BE 60%
If we repeat this calculation for all other values, we were able to better compare the findings of the author with other papers (Figure 21). The mean BE is around 95% with a mean ± standard variation of 75% for the lower band and 114% for the upper band. As we now see 5 out of 11 production series or 45% are below 100%.
While a 95% BE is not that bad, we knew already that pre-composing the substrate for the cultivation of Pleurotus spp. It is not a good idea. But why do people it anyway?
Here we have to keep in mind that the access to wood as a substrate and a steam sterilizer is not available in all countries. Therefore they have to adapt to their individual circumstances.

Figure 21: Estimated biological efficiency (BE) based on figure 20.[19]
HOW to OPTIMIZE COMPOSTING for OYSTER Mushroom Cultivation
The third author compared two different composting methods for cultivation Pleurotus ostreatus. As the primary substrate, he used different substrates and supplemented them with/without wheat bran and rice bran (Table 4).

Table 4: Substrate formulations based on different raw materials with or without supplementation.[20]
The C:N ratio for the different components are shown in table 5.

Table 5: Substrate applied to oyster mushroom cultivation in different composting conditions.[21]
The author did a total of four test runs. The different composting processes are shown in figure 23. The main differences of these tests are first the duration and second, sterilization with or without conditioning.

Figure 23: Composting under different conditions (phases I and II). Substrates: 7 DWOC – 7 days of phase I without conditioning; 7 DWC – 7 days of phase I with conditioning; 14 DWOC – 14 days of phase I without conditioning; 14 DWC – 14 days of phase I with conditioning[22]
During the composting process, the author tracked the temperature, which is shown in figure 24.

Figure 24: Composting temperature (phase I). Peak heating of substrate ricks are indicated per arrows on top of the graphic (7 D – 7 days of phase I; 14 D – 14 days of phase I, following experimental design mentioned in figure 23)[23]
The changes in different parameters during the composting are shown in Figure 25. The more common ones are C:N ratio and pH.

Figure 25: Physiochemical composition of the substrate during composting (phase I and II). A – organic matter, B – C/N ration, C – pH, D – crude energy, E – soluble sugars. Dry basis substrate 7 D – 7 days of phase I; 14 D – 14 days of phase I. Means followed by the same uppercase letter indicate no statistical difference across 7 D of composting. Means following by the same italic uppercase letter indicate no statistical difference across 14 D of composting. Means following by same lowercase indicate no statistical difference between 7 D and 14 D at the same composting stage[24]
After this short introduction, let’s compare all four runs with each other (Figure 26). As shown in figure 26, there is a slight difference when it comes to without and with conditioning for the yield but a big difference for the biological efficiency.
If you choose no conditioning, then a longer composting process seams to increase your yield and BE. If you choose with conditioning, then the difference between 7 days and 14 days is not that much. This means you could go easily with the shorter one and have therefore multiple runs in the same period increasing your overall yield.

Figure 26: Yield and biological efficiency (BE) of Pleurotus ostreatus cultivated und different composting conditions. 7 D and 14 D – 7 days and 14 days of phase I. Means followed by the same lowercase letter indicate no statistical difference at the same phase II condition. Means followed by the same uppercase letter indicate no statistical difference at the same phase I condition[25]
If we look at the changes in C:N (Figure 27), then we see clearly that a smaller ratio leads to a higher yield and BE. The best results were achieved with brizantha grass (SBRI) as a substrate.

Figure 27: Yield and biological efficiency (BE) of Pleurotus ostreatus cultivated und different substrate formulations with and without supplementation. Substrates: SDEC – decumbens grass; SCAN – sugarcane straw; SBRI – brizantha grass; SWHE – wheat straw. Substrate supplementation: C/N ratio of 60:1 – with supplementation; C/N ratio of 90:1 – without supplementation. Means followed by the same lowercase letter indicate no statistical difference at the same C/N ratio (60:1) between different substrates. Means followed by the same italic lowercase letter indicate no statistical difference at the same C/N ratio (90:1) between different substrates. Means followed by the same uppercase letter indicate no statistical difference at the same substrate and different C/N ratio[26]
This behavior can be explained by looking at the temperature profiles (figure 28) of the different substrates during the composting process. As the figure shows, with the brizantha grass, we reached a maximum temperature of 70°C (C:N 60) in comparison with a maximum 60°C for all other mixtures.

Figure 28: Temperature of substrate (phase I) and C/N ratio changes in the different substrate formulations. A – Temperature during phase I, substrates with supplementation (C/N ratio 60:1); B – Temperature during phase I, substrates without supplementation (C/N ratio 90:1); C – C/N ratio changes during composting in the substrates with supplementation (C/N ratio 60:1); D – C/N ratio changes during composting in the substrates without supplementation (C/N ratio 90:1). Substrates: Substrates: SDEC – decumbens grass; SCAN – sugarcane straw; SBRI – brizantha grass; SWHE – wheat straw[27]
CHEMICAL STERILIZATION
Chemical sterilization is typically used because they are inexpensive. During my research, I found many scientific studies in which different chemicals are used to sterilize the substrate. Table 3 gives an overview of these chemicals and their classification accordingly to their risks.
A big disclaimer: The shown information represents the view, and the opinion of mine and are just for education and information purpose only and should not be construed as legal advice or as an offer to perform legal services. The provided information contains general information and may not reflect current legal developments or information. I do not make any representation or warranties concerning the accuracy, applicability, fitness, or completeness of the information. The information is not intended to substitute for professional advice. Please inform yourself by reading the instruction manual, material safety data sheet carefully, and ask your local specialist before using any of these mentioned chemicals. I, therefore, disclaim any and all liability to any party for any direct, indirect, implied, punitive, special, incidental or other consequential damages arising directly or indirectly from this information, which is provided as is, and without warranties.

Table 6: Overview of chemicals used in science papers for the sterilization of mushroom substrate.
With that said, I do not recommend any of them, because the risks of using them for me are too high. They are too poison, toxic, or hazardous to use.
I don’t go into science papers this time, because of the mentioned risks involved by using chemicals.
HOT WATER IMMERSION or SCALDING
Both methods are using 80°C hot water. The difference between the two of them is the duration. For scalding the substrate is typically immersed for 1 hour in hot water (Figure 29). For immersion, the duration is 1,5 hours.

Figure 29: Example of hot water immersion. Source
If you want to learn more about scalding, than this video is for you. In it, I talk about a research project in which different sterilization methods were compared with each other.
AUTOCLAVE STERILIZATION
An autoclave is a big pressure cooker (Figure 30). By utilizing steam, a high-pressure environment is created inside the chamber. The higher the pressure, the higher the temperature of the steam can get. Typically parameters are 121°C and 15 Psi for 1-4 hours.

Figure 30: Example of an autoclave. Source
Super-Pasteurization was first described by Paul Stamets in 1993 and describes a method in which the substrate is pressure-less heated up to 88°C for 12+ hours.
WHAT is the Best STERILIZATION Method – Part 1
In the first research paper the author tested three different sterilization methods (autoclaving at 121°C for 4h, hot water dipping in steel drum at 60°C for 2h and hot water dipping in steel drum at 60°C for 3h) on two different substrates (horse manure compost and sugarcane bagasse) as a pre-treatment for the production of Pleurotus ostreatus. The substrate was supplemented with 20% wheat bran.
Now let’s look at what we got. The first figure (31) shows the influence of the sterilization method on the number of contaminated bags for different substrates. If we compare the two substrates (compost and bagasse), we see clearly that for the compost, the pasteurization method is not enough to reduce the amount of contamination. In both cases, we got 40 contaminated bags out of 40 bags. If the compost was instead autoclaved the number of contaminated bags drops down to only 4 out of 40.

Figure 31: Influence of the sterilization methods on the number of contaminated bags for different substrates.[28]
Next up is the number of days to colonize each bag (figure 32). Here we see two effects. First, if we use pasteurization at 60°C the time at this temperature reduces the number of days to colonize. Second, if we compare pasteurization and autoclaving, we see clearly that the higher temperature of the autoclave process (121°C) reduces the number of days to colonize.
Both parameters temperature and the time at this temperature are playing an important role not only for the reduction of contamination but also for the time it takes to colonize the bags fully.

Figure 32: Influence of the sterilization methods on the time it takes to fully colonize for different substrates.[29]
After these general observations, let’s look at the mushroom itself. First up is the quality (size) of the mushroom stipe and pileus (figure 33). While we see no difference between the sterilization methods for the size of the pileus, autoclaving seems to have a positive impact on the size of the stipe.

Figure 33: Influence of the sterilization methods on the mushroom quality (size) for different substrates.[30]

Figure 34: Influence of the sterilization methods on the mushroom yield per flush for different substrates.[31]
When we compare both sterilization methods, again, we see two effects. The first effect can be seen when we look at the duration of the pasteurization process. The longer the substrate was pasteurized, the higher the yield (Figure 34 and 35). And the second effect can be observed by looking at both sterilization methods for bagasse. Here it seems that autoclaving improves the yield again.

Figure 35: Influence of the sterilization methods on the total mushroom yield for different substrates.[32]
The same goes for biological efficiency (figure 36). The highest BE was achieved by using an autoclave to sterilize the substrate. While pasteurization at 60°C for 2h was leading to the lowest BE. At this point, it is worth mentioning that while autoclaving showed the highest BE, it is with 82% still below the norm (BE 100-200) for this mushroom species.

Figure 36: Influence of the sterilization methods on the biological efficiency for different substrates.[33]
WHAT is the Best STERILIZATION Method – Part 2
In the next science paper, the author analyzed five different sterilization methods for the yield improvement of Pleurotus spp. The sterilization methods are:
- Lab autoclave 121°C for 1h, 15 Psi
- Country style autoclave 1h
- Country style autoclave 2h
- Hot water treatment at boiling temperature for 0.5h
- Ordinary water at room temperature for 0.5h
The author used sawdust (kikar wood), wheat straw, and rice husk and combinations of them as a substrate. The substrates are as following:
- Sawdust 100%
- Sawdust 50% + wheat straw 50%
- Rice husk 100%
- Risk husk 50% + wheat straw 50%
To the substrate, the author added 5% pf lime and covered them for 5 days. The substrate then moisturized until a moisture content of 75%. The bag size was 1 kg.
Okay, now that we have the parameters, let’s dive right into the results.
The first figure (37) compares the impact of the different substrates on the spawn running. Here sawdust (SD) was the fast with 15.75 days the fastest and rice husk (RH) with 23.75 days the longest.

Figure 37: Influence of the substrate on the spawn running.[34]
When it comes to the pinhead formation (figure 38, blue and fruiting formation (figure 38, orange) again, sawdust showed the best result (22.75 days) compared with the other substrates. Only for the fruiting formation the mixture of sawdust and wheat straw (WS) were faster (25 days).

Figure 38: Influence of the substrate on pinhead formation and fruiting formation.[35]
In the following figure (39), we see the influence of the sterilization method on the yield per flush. The best result was achieved by using a lab autoclave. The lowest yield per flush by using only water, which means no treatment at all.

Figure 39: Influence of the sterilization methods on the yield per flush.[36]
Figure 40 shows the discussed results (yield per flush) a total yield. Lab autoclave and country style autoclave are leading to the best results.

Figure 40: Influence of the sterilization methods on the total yield.[37]
WHAT is the Best STERILIZATION Method – Part 3
Next up is a research article that compares four different sterilization methods on cotton waste for the cultivation of Pleurotus spp. (P. florida, P. pulmonaris, P. ostreatus).
The sterilization methods are:
- Control (no treatment)
- Hot water at boiling temperature for 0.5h
- Chemical (Formalin 50%)
- Steam Pasteurization at 80°C for 1h
The substrate had a moisture content of about 70%.
Each bag was 270g.
Here are the results:
The first figure (41) gives us an inside into how good steam pasteurization works and more importantly, how each of the three mushroom species performs. If we look at the 100% mark, we see that Pleurotus ostreatus growth the fastest, followed by Pleurotus pulmonarius and Pleurotus florida respectively.

Figure 41: Number of days taken to complete mycelium growth for Pleurotus spp. in steam pasteurization.[38]
The second figure (42) compare the three different mushroom species if the substrate was pretreated in hot water. Here again, Pleurotus ostreatus performs the best.

Figure 42: Number of days taken to complete mycelium growth for Pleurotus spp. in hot water treatment.[39]
The same goes if the substrate received no treatment at all (Figure 43). It took longer than with treatment, but again Pleurotus ostreatus beats the other two mushroom species.

Figure 43: Number of days taken to complete mycelium growth for Pleurotus spp. without treatment.[40]
And finally the fourth treatment with formalin (Figure 44), here Pleurotus ostreatus outgrowths the other mushroom species.
If I summarized what we learned, I would come to the conclusion that Pleurotus ostreatus is a fast-growing fungus no matter what pre-treatment for the substrate was used.

Figure 44: Number of days taken to complete mycelium growth for Pleurotus spp. in formalin treatment.[41]
Now let’s look at each mushroom species more closely. In figure 45, we can see the development of Pleurotus florida for different substrate treatment throughout each growth stage (25%, 50%, 75%, and 100%).
Here (figure 45) two things stand out. First, steam pasteurization works the best for Pleurotus florida, and second, the treatment with Formalin gives the worst result.

Figure 45: Number of days taken to complete mycelium growth for Pleurotus florida in different treatments.[42]
If we compare the four different substrate treatments and there impact on the growth of Pleurotus pulmonarius, we get a similar result (figure 46). Steam pasteurization is again the best treatment when it comes to growing this mushroom species.

Figure 46: Number of days taken to complete mycelium growth for Pleurotus pulmonarius in different treatments.[43]
And finally, figure 47 tells us something about the growth of Pleurotus ostreatus on the substrate which was treated differently. Not that I want to repeat myself, but steam pasteurization works again the best.

Figure 47: Number of days taken to complete mycelium growth for Pleurotus ostreatus in different treatments.[44]
The final figure (48) compares all four different substrate treatments on the growth of the three Pleurotus species at the 100% mark. The figure summarizes our findings in one diagram.
First, steam pasteurization works the best.
Second, Pleurotus ostreatus growth the fastest.

Figure 48: Number of days taken to complete mycelium growth for Pleurotus spp. in different treatments.[45]
WHAT is the Best STERILIZATION Method – Part 4
The last research paper we will go through will also look at the effect of different substrate disinfection methods on the production of Pleurotus ostreatus.
The author selected the following five methods:
- Autoclave at 121°C for 1.5h
- Scalding at 60°C for 1h
- Scalding at 80°C for 1h
- Scalding at 100°C for 1h
- Chemical disinfection (Formalin 40%) overnight
With that said, let’s interpret the findings. Figure 49 shows us the influence of different disinfection methods on the growth (days) for Pleurotus ostreatus. Here we see three things happening.
First, the autoclave method isn’t that much better than the scalding methods when it comes to NDSR (number of days completing spawn running).
Second, scalding at 100°C for 1h gives a similar result than autoclaving at 121°C for 1.5h. This finding is contrary to the #2 science paper we analyzed. We will talk about that in some minutes.
Third, chemical treatment doesn’t seem that bad after all.

Figure 49: Influence of different disinfection methods on the growth.[46]
In the next figure (50), we compare the influence of the different disinfection methods on the yield per flush. Again, three things can be found by looking at this figure.
First, autoclaving and scalding at 100°C delivering the worst results.
Second, chemical disinfection and scalding at 80°C leads to the best results.
Third, when using the scalding method, 80°C seems to be the optimal temperature when it comes to yield.

Figure 50: Influence of different disinfection methods on the yield per flush.[47]
The next figure (51) summarizes what we found in one diagram, which makes it a little bit easier to spot the differences.

Figure 51: Influence of different disinfection methods on the total yield.[48]
The biological efficiency (Figure 52) delivers the same result as the yield (Figure 51), three out of five disinfection methods are below the norm (BE 100-200%).

Figure 52: Influence of different disinfection methods on biological efficiency.[49]
Now let’s talk about the impact of autoclaving and the chemical treatment more in detail. First, we will compare the two scientific papers #2 (figure 40) and #4 (figure 52) by only focusing on the influence of the different substrate treatments on biological efficiency. Both authors used Pleurotus ostreatus, but different strains (Kahn P-19, Atila HK-25).
By doing this, we will notice several things (Figure 53 and 54).
First, all BE of Atila is below 100%, while all BE of Khan is over 100% (even the no treatment version).
Second, Khan found that by using autoclaving (lab or country) a higher temperature is better (121°C > 100°C).
Third, but it seems that if we extend the time at the higher temperature (121°C) the BE drops (finding of Atila). This means autoclaving at 121°C for 1h is better than autoclaving at 121°C for 1.5h.
Fourth, the hot water treatment of Khan should be similar to the scalding method at 100°C of Atila, but it delivered a way better result.
Figure 53: Influence of different sterilization methods on biological efficiency. (own fig. based on Khan)

Figure 54: Influence of different disinfection methods on biological efficiency. (own fig. based on Atila)
Now, let’s compare science paper #3 (Asif) and #4 (Atila) to understand the impact of formalin on the mycelium growth rate. Both authors used Pleurotus ostreatus but different strains. Atila the HK-35 strain, while Asif didn’t report the strain number. Besides this difference, we get at least an idea about the impact. The 50% formalin treatment of Asif (Figure 55) showed a better result than the 40% treatment of Atila (Figure 56).

Figure 55: Influence of different disinfection methods on the growth. (Own fig. based on Atila)
Figure 56: Number of days taken to complete mycelium growth of Pleurotus spp in different treatments. (own fig. based on Asif)
While comparing different scientific papers with each other, we have to keep in mind that even while the test a run properly, they can’t be compared that easily. Especially because the authors don’t mention, all the details of the test or the conditions are slightly different.
For example, Asif used cotton waste as a substrate, while Kahn chose sawdust, rice husk, wheat straw, and mixtures of them as a substrate which is was emulated by Atila which used one substrate mixture of sawdust 40%, wheat straw 40%, and wheat bran 20%.
The same goes for the used strains. As mentioned, all the authors used Pleurotus ostreatus, they used different strains. But different strains lead to different results.
There are many other parameters that have to be considered when comparing research papers with each other like location (altitude, climate zone) or spawn rate.
But nevertheless, even while they are not directly comparable, we learn a lot by studying and thinking about the differences.
In conjunction with this article, my article How Substrate Influences your Mushroom Yield goes hand in hand. In it, I explain the different compounds of your substrate and how they will impact your mushroom yield.
On the other hand, if you want to learn more about the things which will impact your yield in general, then you will find my article How Do I Increase My Mushroom Yield? helpful.
Now I want to hear from you:
Which sterilization method from this article are you most excited to try?And which method are you using today?
Let me know by leaving a quick comment.
[1] Paul Stamets (1983)
[2] Jaak Ryckeboer (2009)
[3] Jaak Ryckeboer (2009)
[4] Jaak Ryckeboer (2009)
[5] Paul Stamets (1983)
[6] Paul Stamets (1983)
[9] For details about these four test please feel free to read the paper – Wakchaure (2013)
[15] Baláz Vajna (2010)
[16] Baláz Vajna (2010)
[17] Baláz Vajna (2010)
[18] The first number indicates the year of production, while the second number indicates the production series
[19] Own calculation
[28] Own figure based on Oseni (2012)
[29] Own figure based on Oseni (2012)
[30] Own figure based on Oseni (2012)
[31] Own figure based on Oseni (2012)
[32] Own figure based on Oseni (2012)
[33] Own figure based on Oseni (2012)
[34] Own figure base on Khan (2011)
[35] Own figure base on Khan (2011)
[36] Own figure base on Khan (2011)
[37] Own figure base on Khan (2011)
[38] Own figure based on Asif (2004)
[39] Own figure based on Asif (2004)
[40] Own figure based on Asif (2004)
[41] Own figure based on Asif (2004)
[42] Own figure based on Asif (2004)
[43] Own figure based on Asif (2004)
[44] Own figure based on Asif (2004)
[45] Own figure based on Asif (2004)
[46] Own figure based on Atila (2016)
[47] Own figure based on Atila (2016)
Hi,
Thank you very much for the articles that you wrote and shared. They help me in effort to start going in mushroom adventures. Could you please elaborate what is country style autoclave and how to build one. It was not clearly described in the references.
Hi, Thank you for your kind words. I am happy to hear that my articles helped you to start the mushroom adventure. Concerning the country style autoclave, that is something I am still pondering what the author meant with that. Unfortunately, so far, I haven’t found a single answer to that. Sorry that I can’t help you in this regard.
Hi there,
First thank you so much for the best detailed mushroom growing articles on the internet that factually explains the HOW and , especially, the WHY which is extremely important.
I am actually trying to build a mushroom farm and i am struggling with some of the equipment and even raw materials (not available in my region). No autoclaves (extremely high capacity and high prices) and no hardwood either, mostly pine and some eucalyptus..
So, when you have the time, can you please check these two issues/questions below :
1- Do you have any information about the atmospheric sterilization (Paul stamets super pasteurization at 88°c for 12 hours) ?
2- Can i use eucalyptus for wood loving mushrooms (even shiitake) ?
Thanks in advance and grateful for your work
thorough article. I was looking for chemical sterilization methods, and came upon this site, and it is very helpful. Can youplease clarify what is meant by “country style autoclave?” If you mean just keeping it at 100 Deg with no pressure, I understand. Otherwise, I am not sure.
Thank you
Thanks for reaching out and for your feedback. Unfortunately, I can’t. I am still trying to figure out what the author meant by “country style autoclave.” It is likely the design and less the process, as he compares this method with a lab autoclave.
Hi there,
I am currently using lime pasteurization, but I am struggling with a high rate of contamination.
Hi Jack, Thanks for stopping by. To understand your problem better, can you share what substrate are you using? How old is it? How much lime are you using? What is the pH value? For how long are you submerging your substrate? Do you use supplements? If yes, what and at what rate? What is your spawn rate? What is the temperature and humidity you are growing your mushrooms, and what kind of mushroom species are we talking about.